





Vacation Rental Occupancy Rate: How to Measure It Without Sacrificing Profitability?
The occupancy rate for vacation rentals is often one of the first metrics reviewed. However, it can lead to misleading conclusions. Having many booked nights seems positive, but it does not prove that a property is profitable.
High occupancy may be due to low prices or limited availability. Therefore, filling more nights does not always result in a higher profit margin.
This KPI is useful when calculated consistently and compared with revenue and costs. The goal is to balance availability, demand, rate, and profit.
Translated with DeepL.com (free version)
What does the occupancy rate measure?
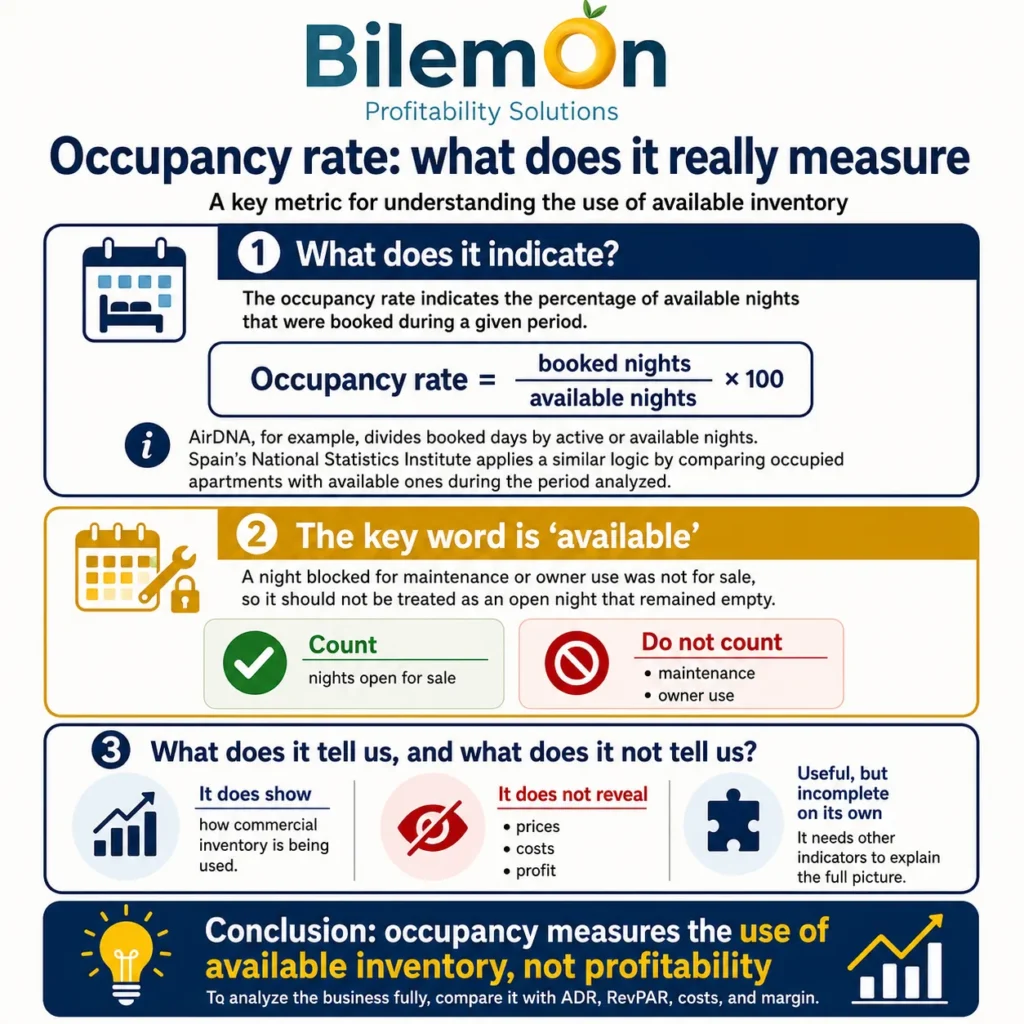
The occupancy rate indicates the percentage of available nights booked during a given period. AirDNA, for example, divides the number of booked days by the number of active or available nights. The National Institute of Statistics applies a similar approach by comparing the number of occupied apartments to the number of available apartments during the period analyzed.
The key word is “available.” A night blocked for maintenance or owner use could not be sold. Therefore, it should not be treated as an open night that remained vacant.
This indicator shows how marketable inventory is utilized, but it does not reveal prices, costs, or profit.
How do you calculate the occupancy rate correctly?
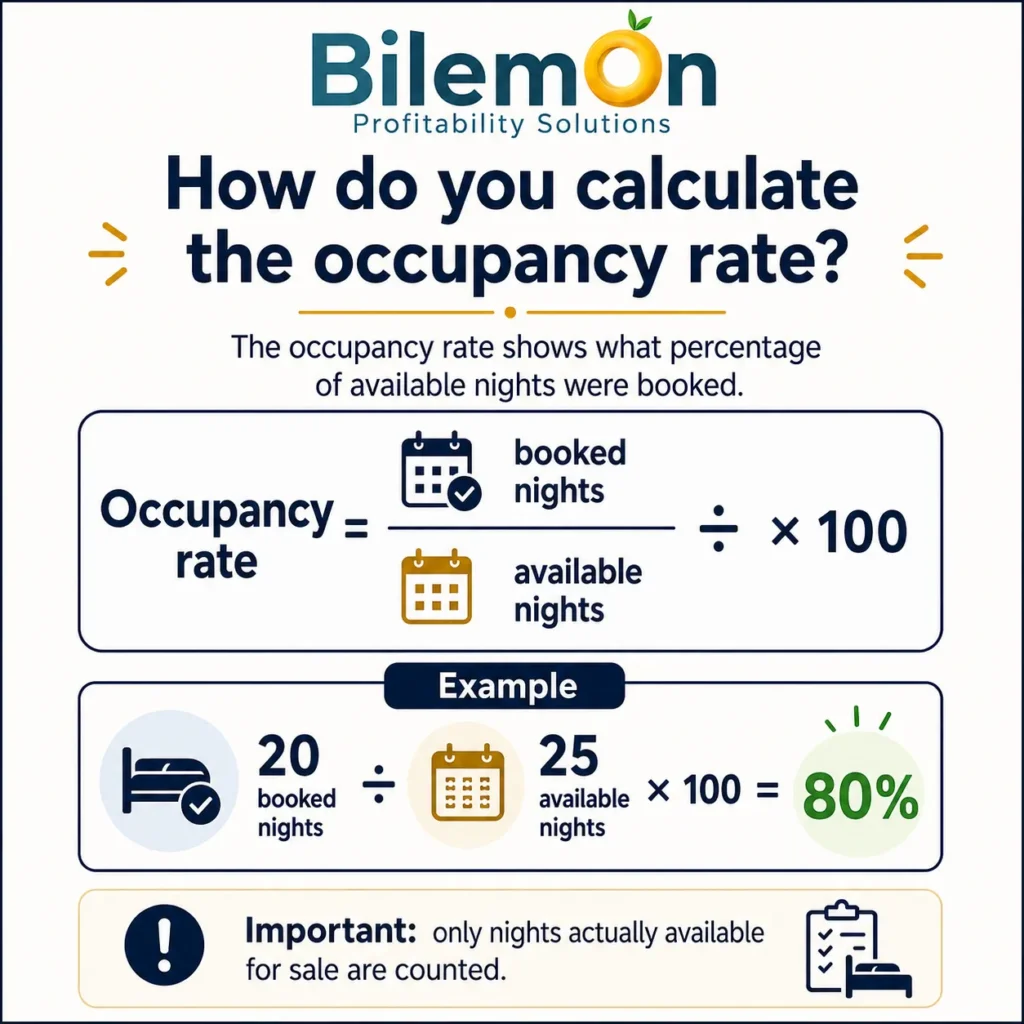
Let’s say a property was available for 25 nights during a month. If it received reservations for 20 nights, its occupancy rate was 80%.
The challenge lies in the denominator. If the calendar had five nights blocked for personal use, those dates should not be counted. On the other hand, if they were available and no one booked them, they should be included.
A year-round rental is not comparable to one that is only available during peak season.
The manager must document cancellations, owner stays, and closures for maintenance. This way, they can compare properties and time periods using the same criteria every time.
Example: Higher occupancy doesn’t always mean higher profit margin
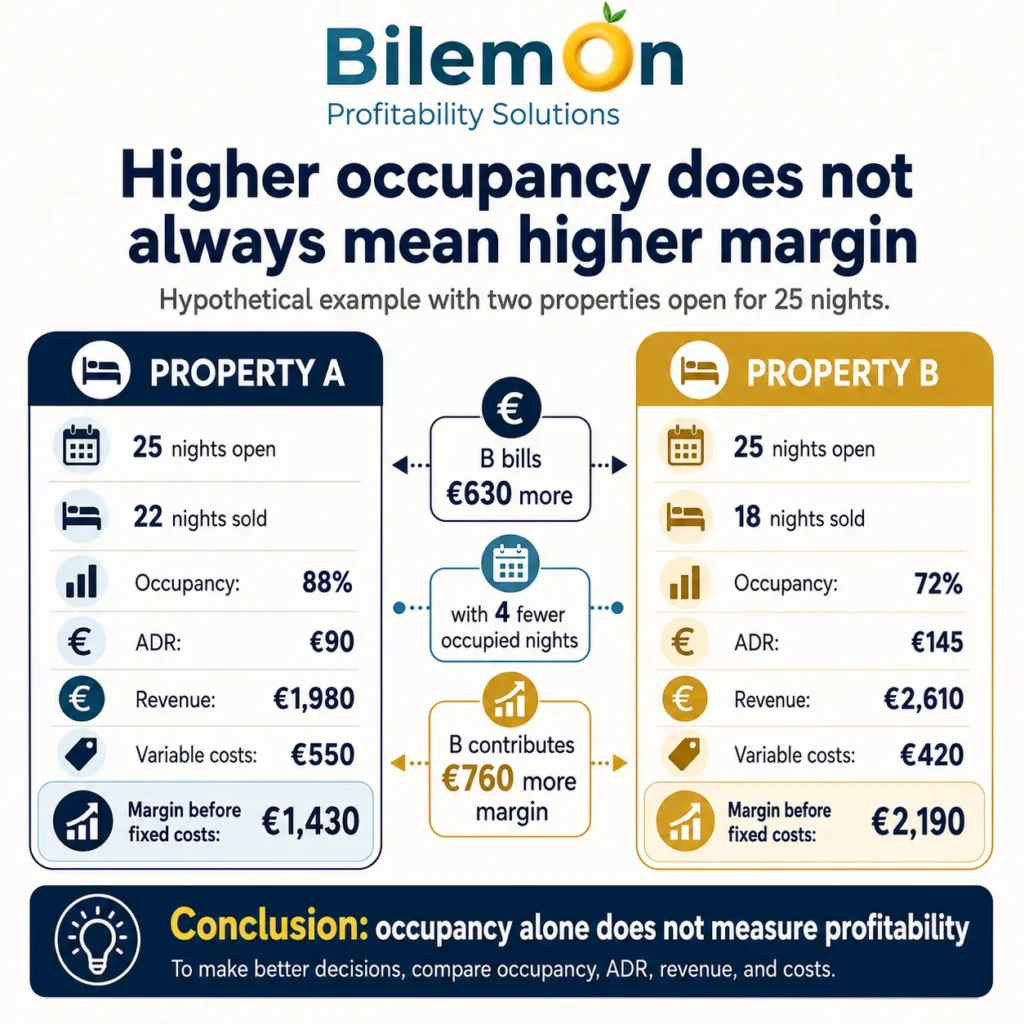
Let’s look at a hypothetical example involving two properties open for 25 nights.
Property A has an occupancy rate of 88% and an average daily rate (ADR) of 90 euros. It sells 22 nights and generates 1,980 euros.
Property B achieves a 72% occupancy rate and an ADR of 145 euros. It sells 18 nights and generates 2,610 euros.
However, Property B brings in 630 euros more with four fewer occupied nights.
Let’s add hypothetical variable costs. Property A incurs 550 euros in cleaning, laundry, supplies, and guest services. Property B incurs 420 euros.
After subtracting these costs, Property A retains 1,430 euros. Property B retains 2,190 euros. The property with lower occupancy generates 760 euros more before fixed costs.
This example demonstrates that occupancy alone does not measure profitability.
Common Mistakes When Measuring Occupancy
The first mistake is to count every night on the calendar as available. This artificially lowers the occupancy rate when the property was actually closed for legitimate reasons.
The second mistake is to exclude empty nights that were actually listed for sale. This practice inflates the occupancy rate and masks demand or pricing issues.
It’s also common to compare different calendars. A property available 365 days a year may have a lower occupancy rate but generate more annual revenue.
Another mistake is using occupancy as the sole metric. If the team receives incentives for filling the calendar, they may offer discounts that erode the margin.
Finally, many short stays boost occupancy but multiply operating costs.
A property with numerous two-night bookings may require more cleaning and attention than one with the same number of occupied nights but longer stays.
Relationship Between Occupancy, ADR, RevPAR, and Costs
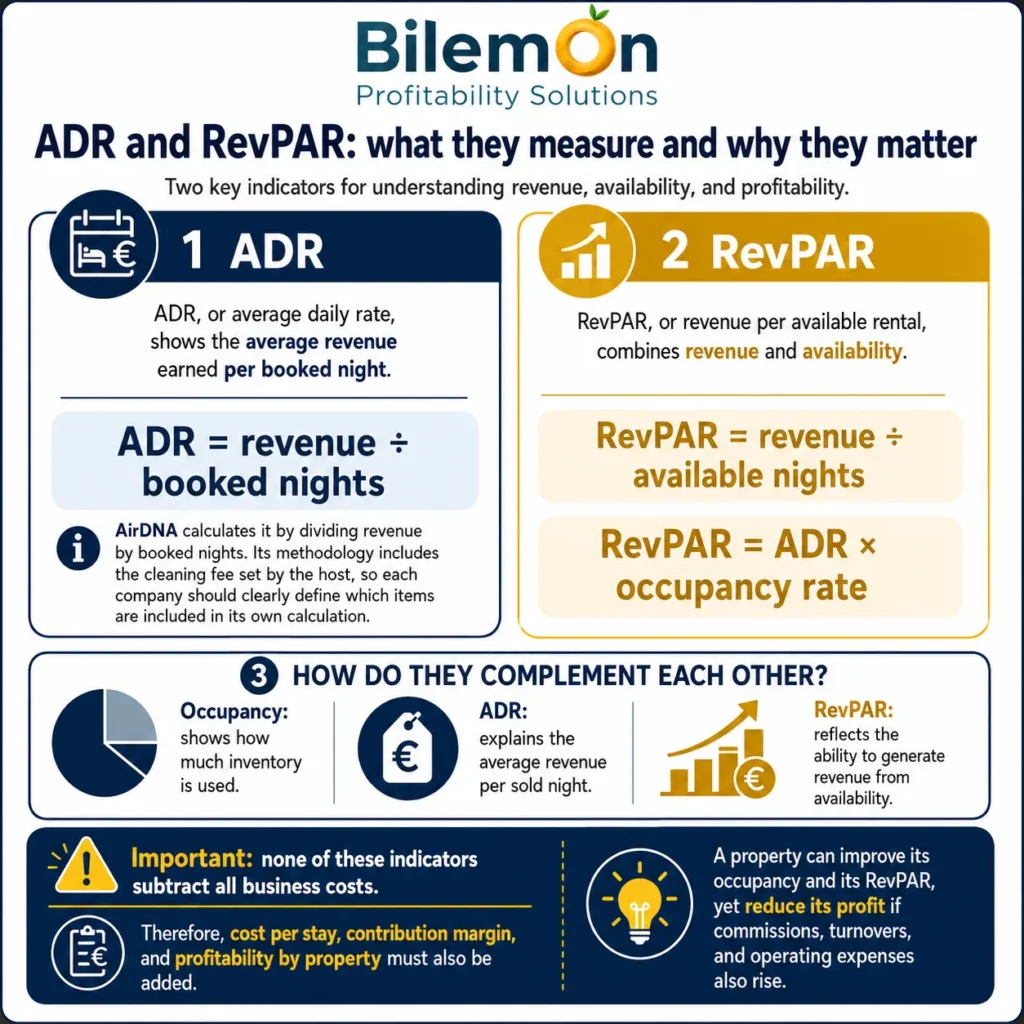
ADR, or average daily rate, shows the average revenue generated per reserved night.
AirDNA calculates this metric by dividing revenue by the number of reserved nights. Its methodology includes the cleaning fee set by the host, so each company must clearly define which items it includes in its own calculation.
RevPAR, or revenue per available room, combines revenue and availability. It can be calculated by dividing revenue by available nights. It can also be expressed as ADR multiplied by the occupancy rate.
These metrics complement each other. Occupancy shows how much inventory is being used. ADR explains the average revenue per night sold. RevPAR reflects the ability to generate revenue from available inventory.
However, none of them account for all business costs. Therefore, cost per stay, contribution margin, and profitability per property must be factored in.
A property can improve its occupancy and RevPAR but reduce its profit if commissions, turnover, and operating expenses also increase.
How to Interpret Occupancy by Property
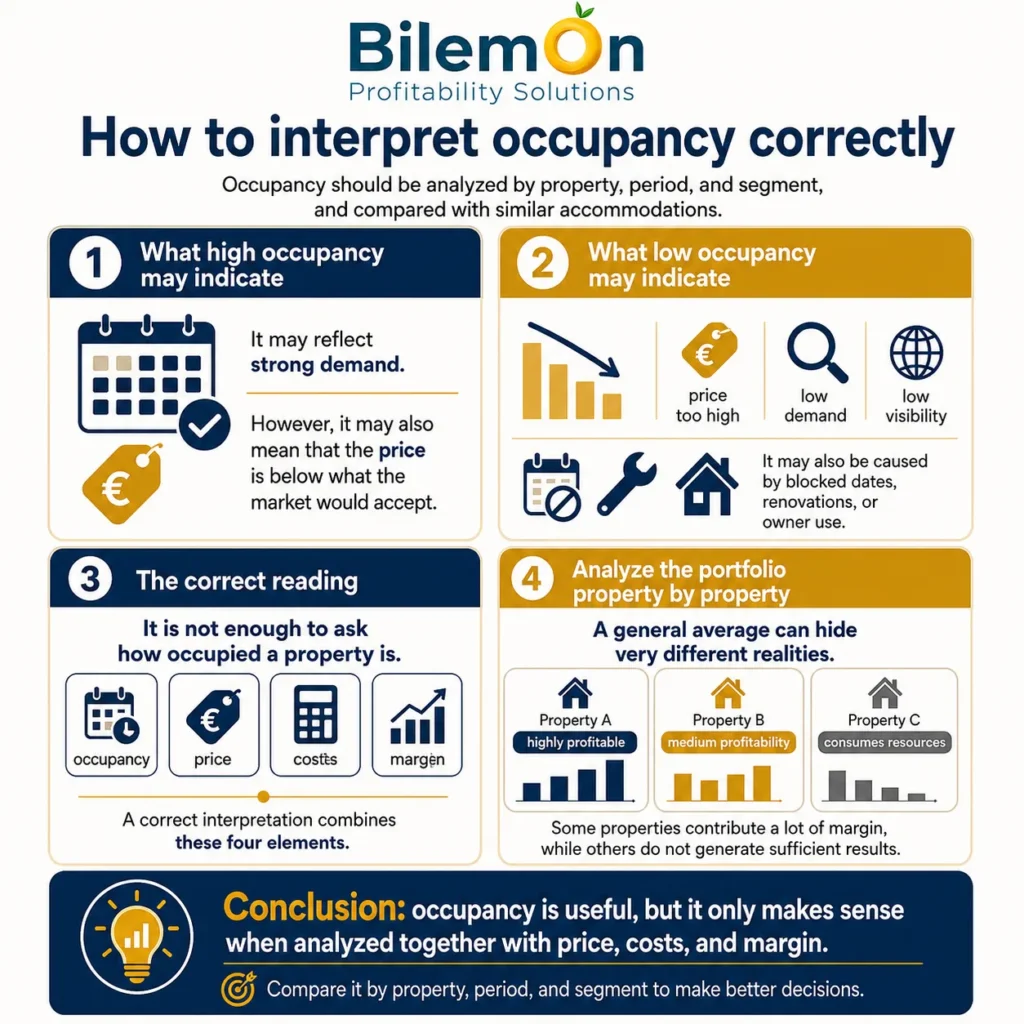
Occupancy should be analyzed by property, period, and segment. It’s also a good idea to compare it with similar properties.
A high occupancy rate may indicate strong demand. However, it may also suggest that the price is below what the market would accept.
Low occupancy may be due to an excessive rate, low demand, or poor visibility. On the other hand, it may be the result of closures, renovations, or owner-occupancy.
A proper analysis doesn’t just ask how often a property is occupied. It also asks at what price, with what costs, and with what margin.
Furthermore, a portfolio should be analyzed property by property. An overall average can mask highly profitable properties and others that consume resources without generating sufficient returns.
How to Improve Occupancy Without Compromising Profitability
First, check actual availability. Unnecessary blackouts reduce available room nights and can limit revenue.
Next, analyze the balance between ADR and occupancy. Lowering prices can increase bookings, though it doesn’t always improve net revenue.
It’s also a good idea to consider the minimum stay requirement. An overly restrictive policy can leave gaps that are difficult to fill. On the other hand, accepting very short stays can drive up costs.
Additionally, compare booking channels, as each brings different demand, commission rates, and terms.
Finally, calculate the margin on additional reservations. An extra night only improves your bottom line if the incremental revenue exceeds its costs.
For example, accepting a discounted reservation may be appropriate when it fills a night that would otherwise likely remain vacant. However, the same decision can be detrimental during a period of high demand.
How Bilemon Helps Put Employment into Context

Bilemon helps centralize and organize information on reservations, properties, revenue, costs, and bank transactions. This allows you to compare occupancy rates with the actual profit margin for each property.
Categorizing costs helps identify highly occupied properties that consume too many resources.
Bilemon does not replace the PMS or set prices. Its value lies in converting operational and financial data into useful information for decision-making.
For example, the manager can verify whether an improvement in occupancy translates into higher net revenue, a larger margin, or simply more operational work.
The manager can also compare properties, time periods, and owners using consistent criteria. As a result, decisions are no longer based solely on general percentages and become precise and accurate.
Frequently Asked Questions
You should include nights when the property was open and available for booking. However, actual closures due to maintenance or the owner’s personal use are typically excluded. The important thing is to apply a consistent rule and document how blockouts, cancellations, and operational closures are handled.
There is no universal percentage. Occupancy depends on the season, the type of accommodation, availability, and pricing strategy. Therefore, it should be compared to equivalent periods, similar properties, and your own goals. A high occupancy rate is only positive when it maintains adequate revenue and margins.
Yes. This can happen when reservations are made at low rates, with discounts, or for very short stays. In addition, higher turnover increases the need for cleaning, laundry, and guest service. Therefore, it’s a good idea to calculate the net revenue and profit margin for the additional nights.
Occupancy measures the percentage of available nights that have been booked. RevPAR measures revenue per available room. Therefore, it incorporates both occupancy and average rate. Even so, it remains a revenue metric. To determine profitability, commissions and costs must be added.
Measuring Occupancy to Make Better Decisions
The vacation rental occupancy rate is useful, but it shouldn’t become a standalone goal. Its purpose is to show how each property’s available inventory is being utilized.
The next step is to compare occupancy, ADR, net revenue, and costs using a single metric. This will help you identify which properties fill the calendar and which ones turn that activity into profit.
Bilemon lets you organize this information and check whether the properties with the highest occupancy are also the ones that generate the most profit.